Yeast growth : How to study a fungus cell?
I- microscope observation

- Place a drop of the yeast culture you have in your beaker, on a microscope slide (you might have to dilute it a bit if you want to isolate a cell during your observation ).
- Place a coverslip on top and observe under different magnifications. High magnifications will be needed to see the yeast correctly.
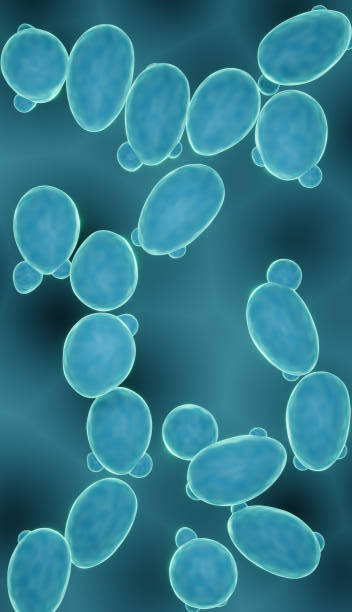
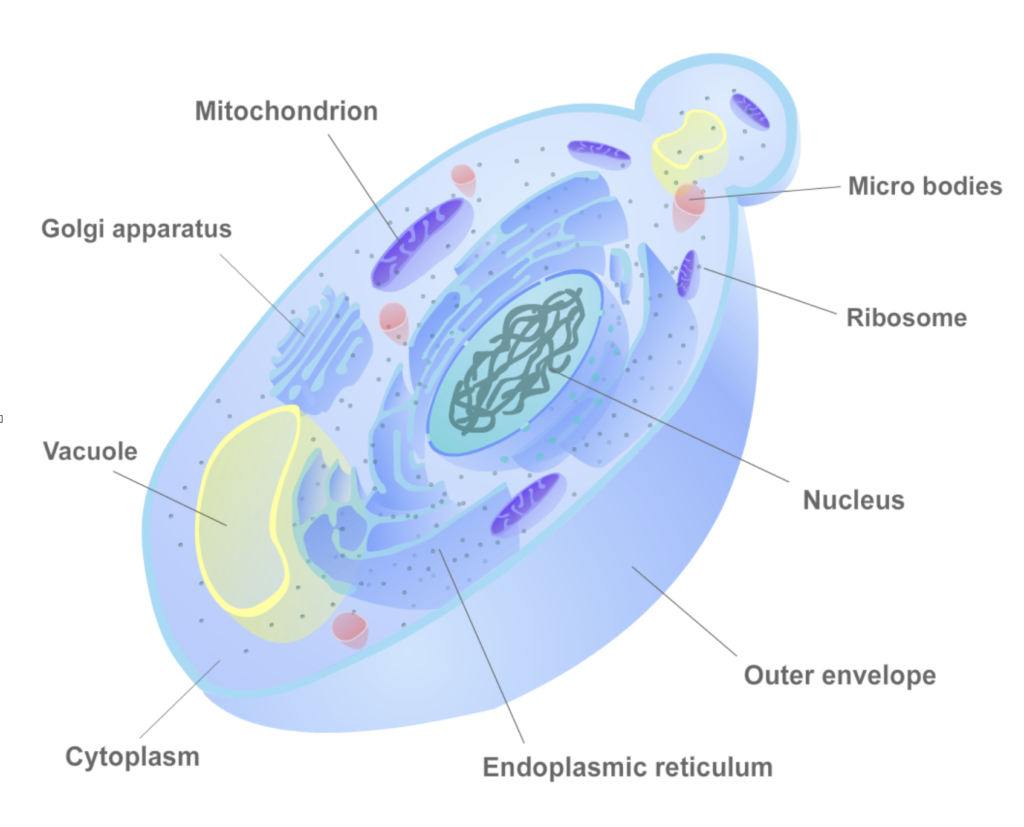
- Draw a yeast cell and label it only with : membrane , nucleus, cytoplasm, if it is possible,the vacuole (that’s all you can observe with the optic microscope). Help yourself with the diagram of a yeast cell just below…
Diagram of a yeast cell labelled
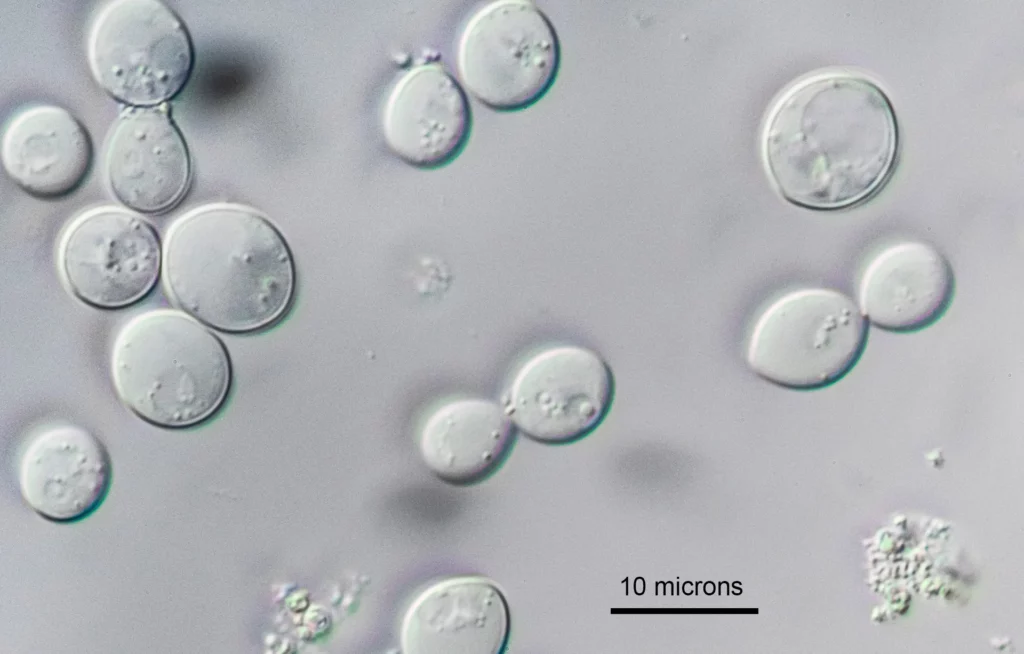
A microscope observation (by motic microscope)
At home, you can visit this website to familiarize yourself with the cell structure : http://www.biocourseware.com/iphone/cell/index_pad.htm
II- HOW DOES SUGAR AFFECT THE GROWTH OF YEAST?
MATERIALS
- 2 glass measuring cups, 2 beakers and 1 erlenmeyer flask
- teaspoon
- granulated sugar (saccharose)
- distilled water
- a packet of Yeast
- scales
- a microscope
- Kova slides
A Kova slide is a special slide with 10 compartments called cupules to count cells.
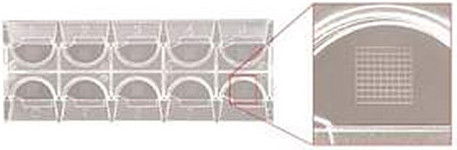
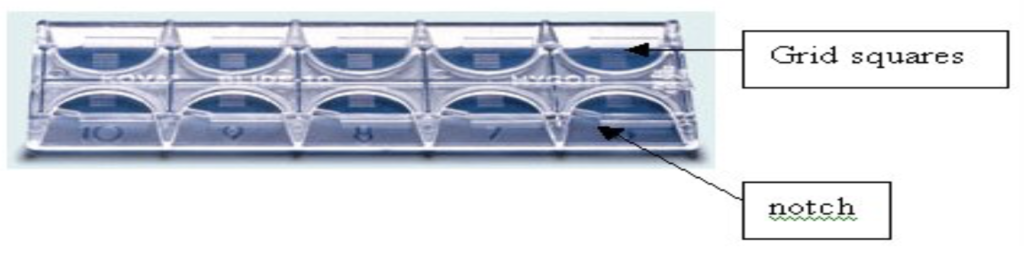
Each cupule has a grid with 9 large squares. Each large square is cut into 9 small squares. The volume of the entire grid (of the 9 large squares) is 1 µL. For a large square (formed of 9 small squares) is 0,1 µL. The volume of a small square is 0,01 µL.
protocole
- You have a yeast’s solution (erlenmeyer 1 = yeasts with a high concentration of glucose or erlenmeyer 2 = yeasts with a low concentration of glucose).
- Mix it and withdraw 10 µL with the pipette.
- Put it in one cupule of the Kova slide : 1 µL is in the grid.
- Use a microscope to count the quantity of yeast, first in a small square, then in a large square and finally in the grid.
1) How many yeasts do you have in your small square / large square / grid ?
2) How many yeasts do you have in your erlenmeyer / beaker ?
3) Fill in the table with your group’s results.
4) Calculate the average of the number of yeasts.
5) Compare the results of erlenmeyer 1 and erlenmeyer 2.
6) What do yeasts need to grow ?
Graph: (if we have time)
Prepare a graph to summarize the data you recorded in your table framacalc.
- Label the Y-axis
- then the X-axis time (days)
- Choose an appropriate scale
- Plot the data for yeast with no sugar and with sugar
don’t forget your title!